
Tableau
The projects included here have been completed using the well known data visualization platform, Tableau.
Below are two projects I had completed for a data visualizations course, last semester. The objective of the assignments in this course were to complete similar projects on different platforms, via the same data. The rubric required that we execute a list of questions specific to our data, and without reusing charts.
The first project was done using “Superstore” data to create a mock minimart store’s sales dashboard. The second project was done using historic Airbnb rental data to create a dashboard that analyzes listing information. This project is identical to the one I’ve completed via PowerBI. The input data for both projects is borrowed from Kaggle.
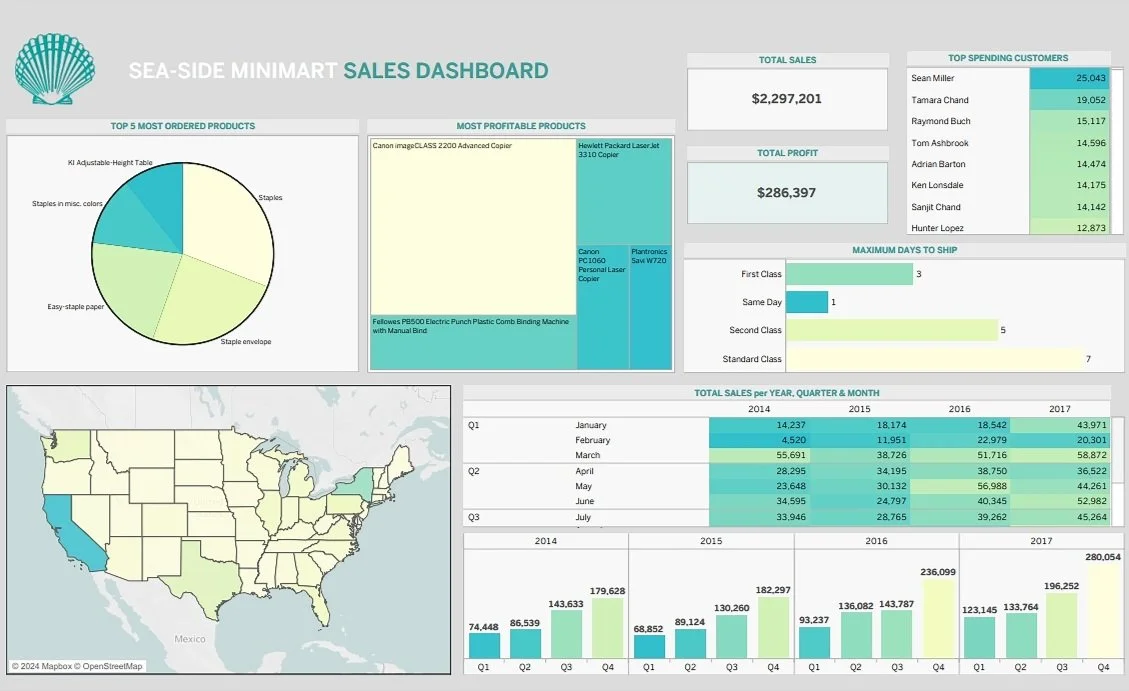
Sea-Side Minimart; Sales Dashboard
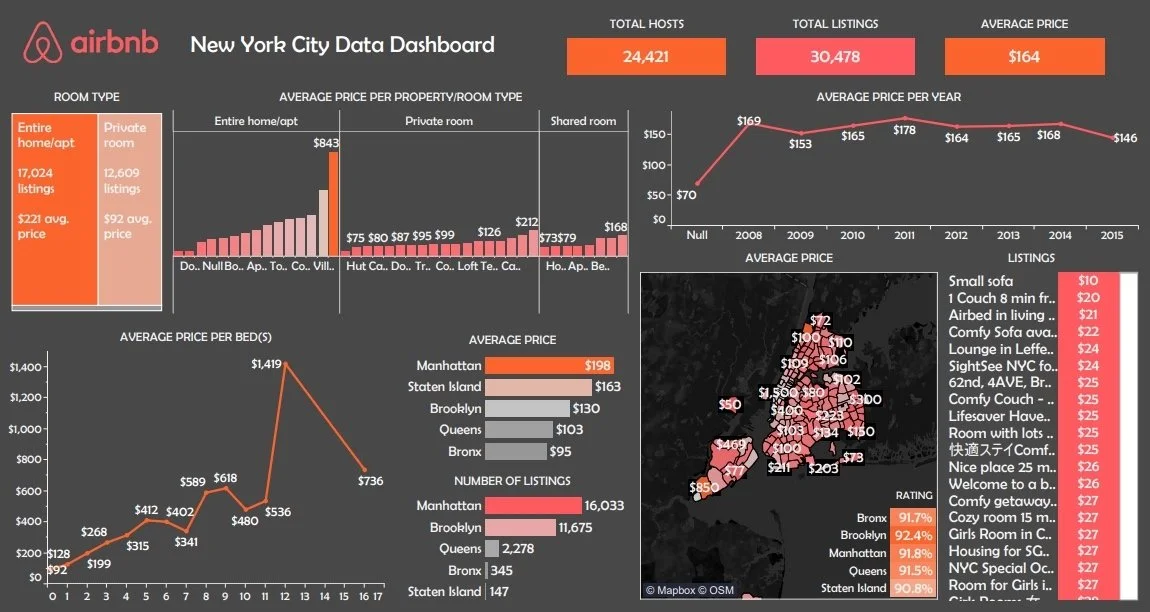
Airbnb; NYC Data Dashboard
Tableau x PowerBI
This project was used as the final exam for my data visualizations course. The objective of this assignment was to complete the same dashboard in both platforms.