
Python Projects
The projects I’ve chosen to include here range from basic applied language, to machine learning models. For now, below are some of the group projects and case studies completed as graduate coursework. All assignments below received the letter grade ‘A’, or 100%.
Most of my projects are in the form of scripts and notebooks, fully open-sourced on my GitHub repository, Python.
Machine Learning - Group, Final Project
Implementing a Model to Predict Hospital Readmission from Diabetes Diagnosis
This model utilizes several features of diabetes diagnosis to predict levels in patients’ hospital readmissions. The target of this paper is to analyze whether these diabetes diagnosis variables hold association in forecasting hospital readmission using decision tree classifiers, logistic regression, and discriminant analysis algorithms.
With machine learning, we hope to alleviate hospital operation costs by choosing which combination of measures of diabetes diagnosis will result in readmission. The length of the dataset (a decade) will provide us with enough observations to accurately predict readmission results. Ultimately, the goal of this analysis is to help companies within the healthcare industry to better allocate resources to strategically reduce the immense costs of hospital readmissions currently compromising company efficiency.
The dataset titled, Predicting Hospital Readmissions has been retrieved from the data science online platform Kaggle, containing historical data for 10 years of patient information. This data consists of both numerical and categorical variables, as well as calculated variables.
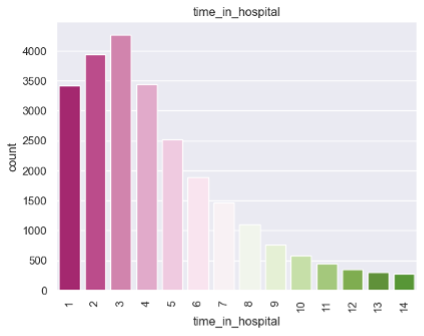


Distribution of Diagnosis
Cleansing, Pre-Processing & Transformation Overview
Dropping Bad & Missing Data
Creating New Features Encoding Categorical Variables
Technology & Analysis
Logistic Regression Classification
Decision Tree Classification
Descriptive Statistics
Discriminant Analysis Algorithm
Business Insights
Contents
Use the link below to download a presentation summarizing the findings of this model.
Capstone - Group, Case Study #1
Predicting Flight Delay using Multiple Linear Regression
This project explores flight delays using Multiple Linear Regression (MLR), identifying key factors that influence late arrivals. By analyzing 3,593 observations from 14 airline carriers, we build a predictive model that helps airlines optimize operations, reduce costs, and improve scheduling efficiency.
Through rigorous data cleaning, exploratory analysis, and statistical modeling, the study uncovers the most impactful variables, such as airport distance, number of flights, baggage loading time, and weather conditions. The final model achieves an R-squared value of 0.82, demonstrating strong predictive accuracy.
To enhance reliability, we apply diagnostic tests for linearity, normality, multicollinearity, and residual independence, ensuring the model meets statistical assumptions. We also explore Lasso and Ridge Regression to improve performance and prevent overfitting.
Ultimately, this study provides data-driven recommendations for airlines to strategically reduce delays, optimize scheduling, and enhance passenger experience. Future improvements include integrating real-time data and API-driven forecasting for dynamic predictions.
Learning Objectives
Analyze flight delays' economic impact and improve scheduling efficiency
Apply Multiple Linear Regression, Lasso, and Ridge Regression for predictive modeling
Validate models with assumption testing, multicollinearity checks, and diagnostic methods
Implement data-driven decision-making to optimize airline operations


Data Preparation & Processing
Data Cleaning: Handling Missing Values & Outliers
Exploratory Data Analysis (EDA): Graphical & Statistical Summaries
Feature Selection, Transformation & Categorical Encoding
Predictive Modeling & Diagnostics
Multiple Linear Regression, Lasso & Ridge Regression (Regularization)
Model Validation via Cross-Validation
Assumption Testing: Residual Plots (Linearity), QQ Plot (Normality), Scale-Location Plot (Homoscedasticity), Cook’s Distance (Influential Points)
Multicollinearity & Autocorrelation Checks: VIF, Durbin-Watson Test
Heteroscedasticity Check: NCV Score Test
Evaluation & Business Impact
Model Interpretation: Key Findings & Variable Significance
Cost Reduction Strategies: Optimizing Baggage Handling, Flight Scheduling, & Support Crew Allocation
Future Enhancements: Real-Time Data, API Forecasting, Regional Analysis
Use the link below to download a presentation summarizing the findings of this model.
Capstone - Group, Case Study #2
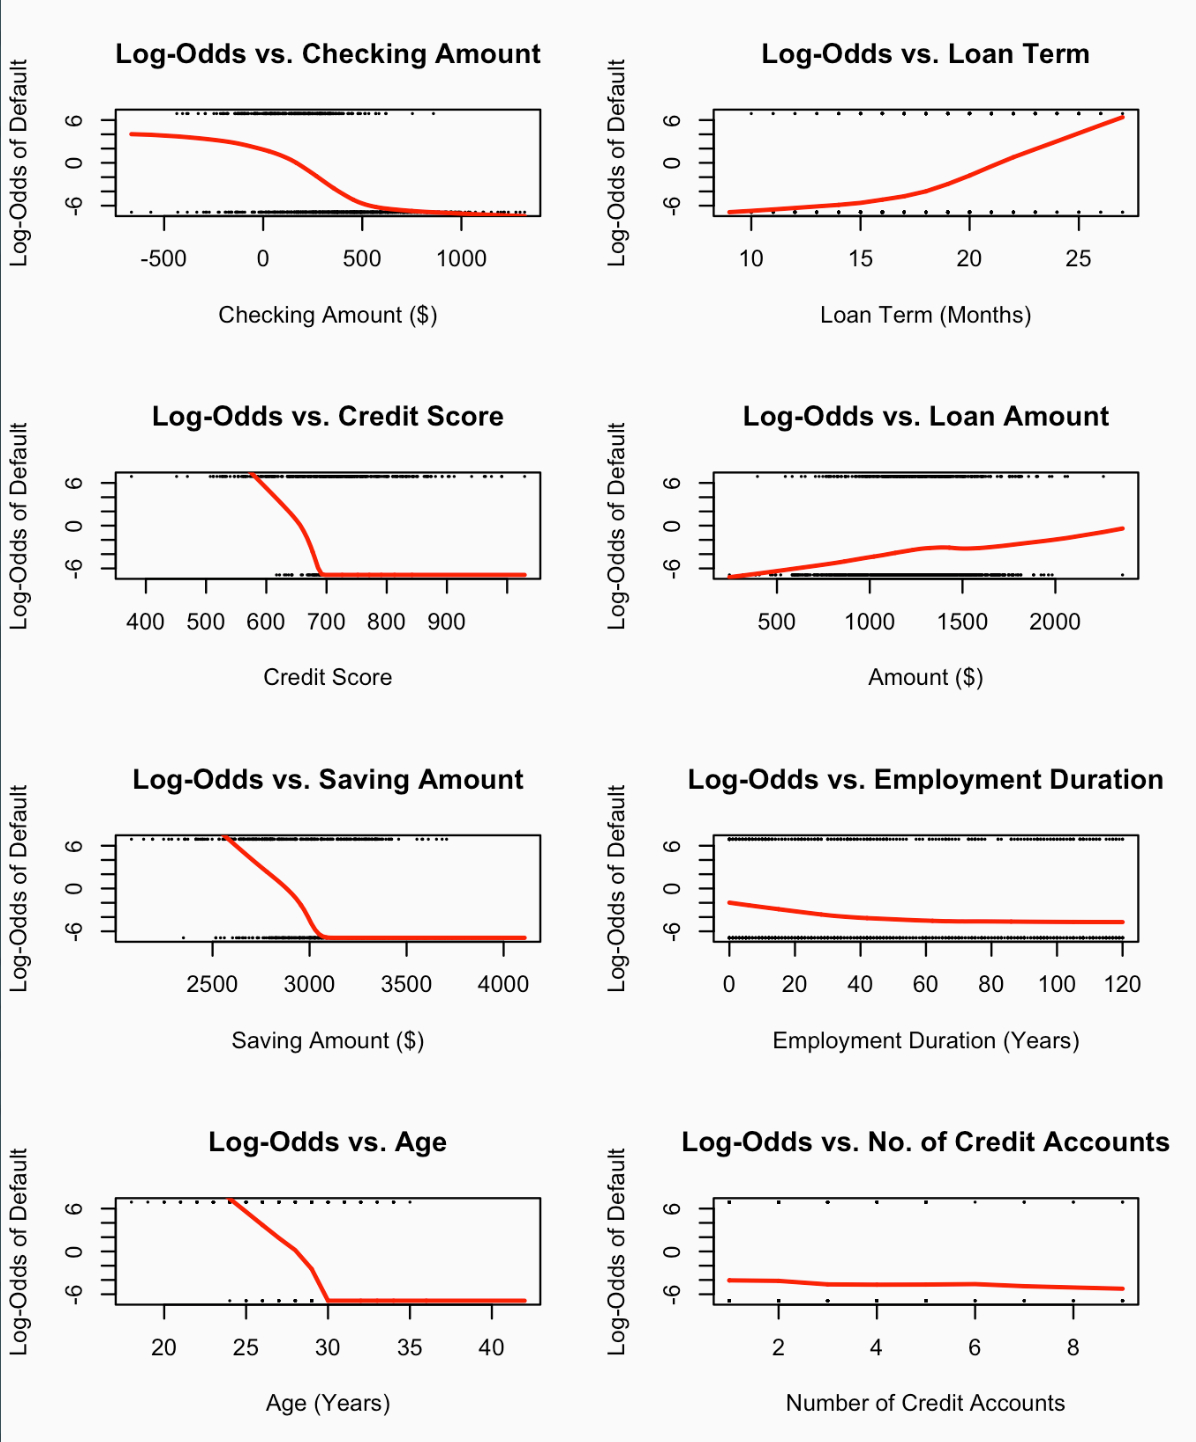
Predicting Bank-Loan Defaults using Logistic Regression
This project explores credit risk assessment by applying logistic regression to predict bank loan defaults based on financial and demographic factors. Using 1,000 observations, the study examines the impact of checking account balances, loan terms, credit scores, employment status, savings, and age on default probability.
Through data cleaning, exploratory analysis, and statistical modeling, the model is refined to enhance predictive accuracy while maintaining interpretability. Key statistical tests, including the Hosmer-Lemeshow test, Wald test, Variance Inflation Factor (VIF), and Likelihood Ratio Test (LRT), ensure robustness. The final model achieves an AUC of 0.986, demonstrating strong predictive performance.
This analysis provides data-driven insights to help financial institutions reduce risk, improve loan approval strategies, and enhance regulatory compliance. Future refinements may integrate decision trees and random forests for more dynamic credit risk modeling.


Data Preparation & Pre-Processing
Exploratory Data Analysis (EDA): Summary Statistics & Correlation Testing
Log-Odds Transformation for Linear Relationship Checks
Train-Test Split (70-30) for Model Validation
Predictive Modeling & Statistical Testing
Logistic Regression for Binary Classification
Wald Test for Predictor Significance
Likelihood Ratio Test (LRT) for Model Refinement
Hosmer-Lemeshow Test for Model Fit
Variance Inflation Factor (VIF) for Multicollinearity Detection
Model Validation & Performance Evaluation
ROC Curve & AUC (0.986) for Predictive Strength
Comparison of Initial vs. Final Model to Improve Accuracy
Assessing Overfitting & Generalizability
Business Impact & Future Enhancements
Identifying Key Risk Factors for Loan Default
Optimizing Lending Strategies with Predictive Analytics
Potential Extensions: Decision Trees, Random Forests, and Additional Variables
Use the link below to download a presentation summarizing the findings of this model.

Capstone - Group, Case Study #3
Sales Forecasting in the Retail Industry Using SARIMA
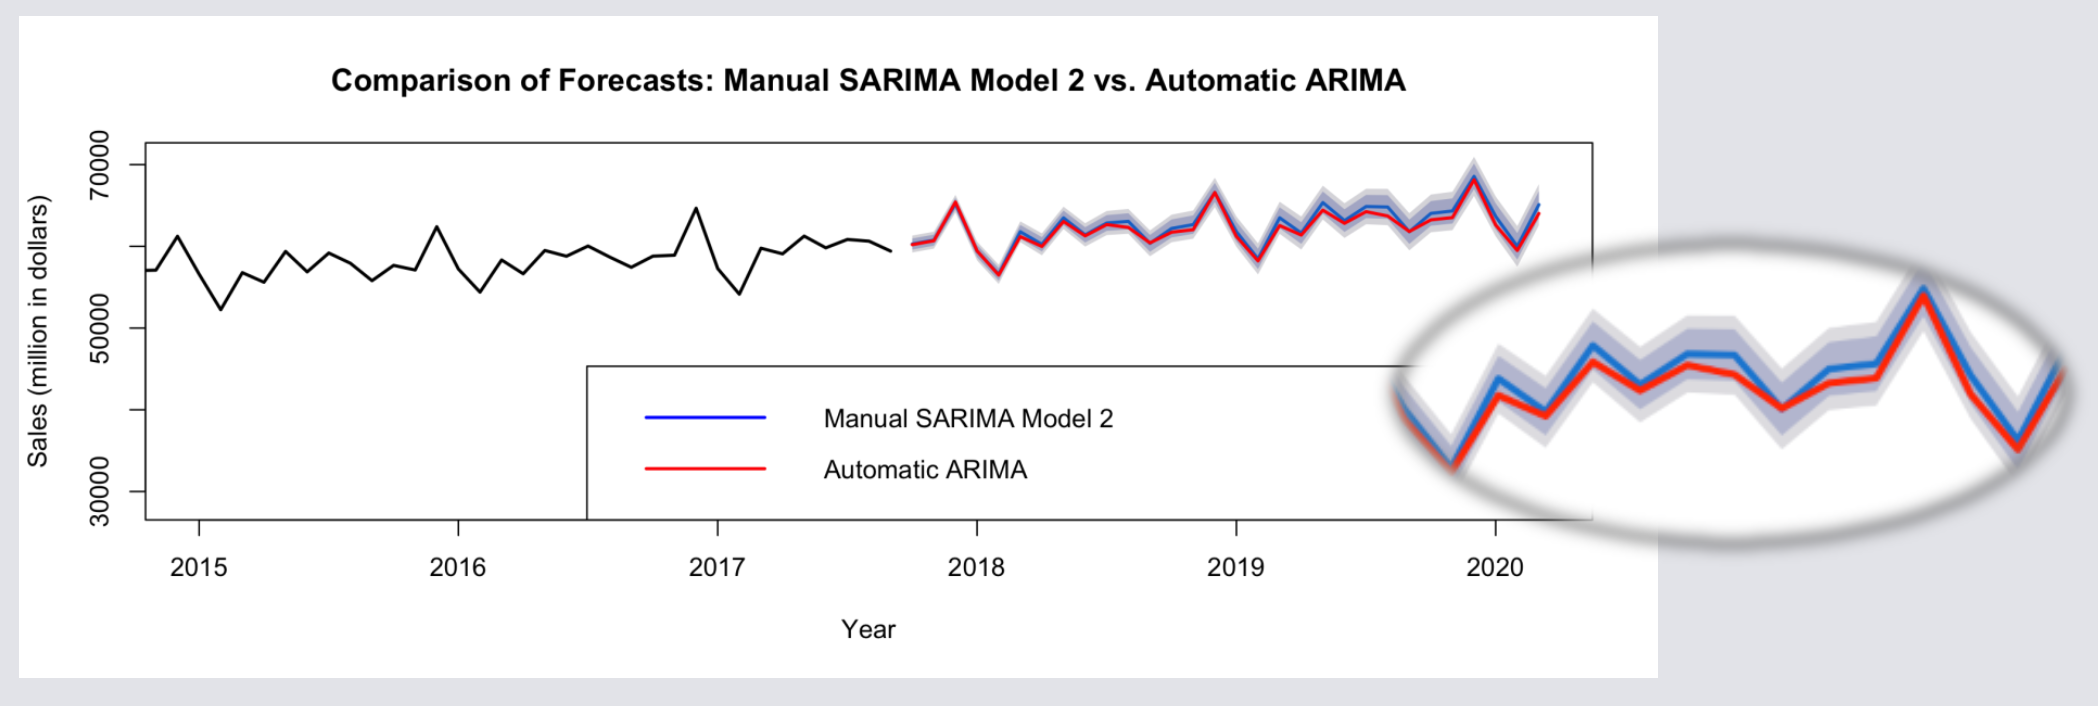
This project applies Seasonal ARIMA (SARIMA) to forecast monthly food and beverage sales for Glen Food & Beverage Co. The retail industry is heavily influenced by seasonal trends, economic cycles, and consumer behavior, making accurate forecasting essential for inventory management, staffing, and financial planning.
Using 309 monthly observations from 1992 to 2017, the study builds and evaluates time-series models, ensuring stationarity through differencing techniques and selecting optimal parameters via AIC and BIC criteria. The final SARIMA(6,1,1)(2,1,2)[12] model effectively captures seasonal fluctuations, outperforming Auto ARIMA in predictive accuracy.
This analysis enables data-driven decision-making, helping Glen optimize inventory levels, reduce stockouts, and align resources with demand surges. Future enhancements include cross-validation and alternative machine learning methods for improving long-term forecasting accuracy.


Time-Series Data Processing & Pre-Modeling
Exploratory Data Analysis (EDA): Summary statistics, trend analysis, seasonality detection
Stationarity Testing: Augmented Dickey-Fuller Test (ADF)
Data Transformation: First and seasonal differencing for stationarity
Predictive Modeling & Model Selection
SARIMA Model Development: Parameter tuning (p, d, q, P, D, Q)
Model Selection via AIC & BIC: Balancing accuracy and complexity
Comparison with Auto ARIMA: Evaluating automated vs. manual tuning
Model Validation & Forecast Evaluation
Residual Diagnostics: Box-Ljung Test for white noise assumption
Forecast Performance: Comparing predictive accuracy of SARIMA vs. Auto ARIMA
Business Insights: Aligning forecasting results with inventory and demand planning
Business Impact & Future Enhancements
Optimizing supply chain, pricing strategies, and promotional planning
Enhancing forecasting with cross-validation, rolling origin testing, and alternative ML models
Exploring real-time data integration for dynamic forecasting improvements
Use the link below to download a presentation summarizing the findings of this model.

Capstone - Group, Case Study #4
Churn Prediction for the Telecommunications Industry A Comprehensive Analysis of Decision Tree vs. Random Forest
This project applies Decision Tree and Random Forest models to predict customer churn in the telecommunications industry. Customer churn—the rate at which users discontinue service—is a critical business concern, as retaining customers is significantly more cost-effective than acquiring new ones. By leveraging 1,000 customer records with 14 features, this study identifies the key drivers of churn and evaluates predictive model performance.
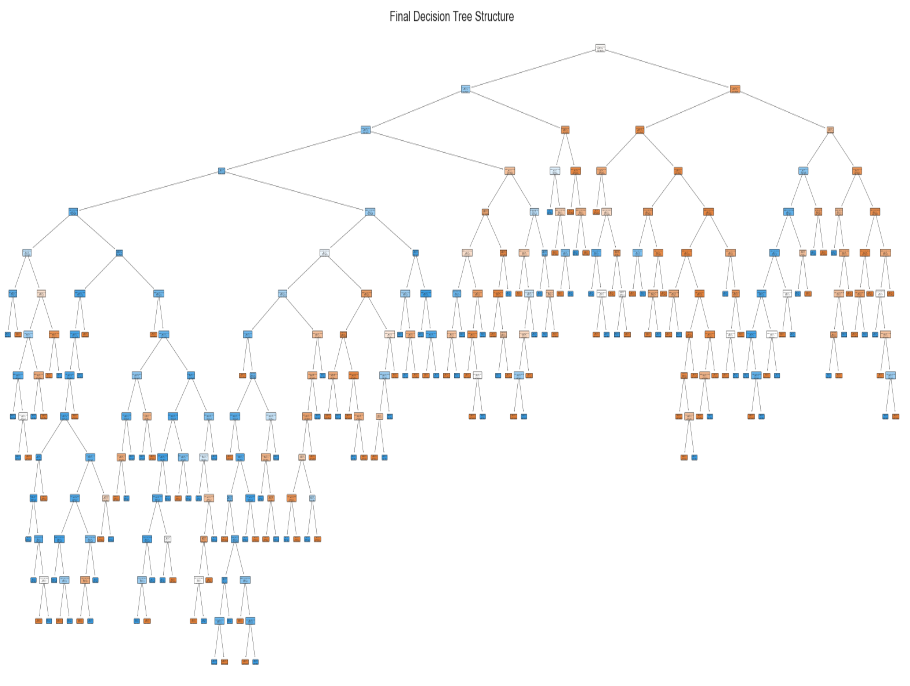
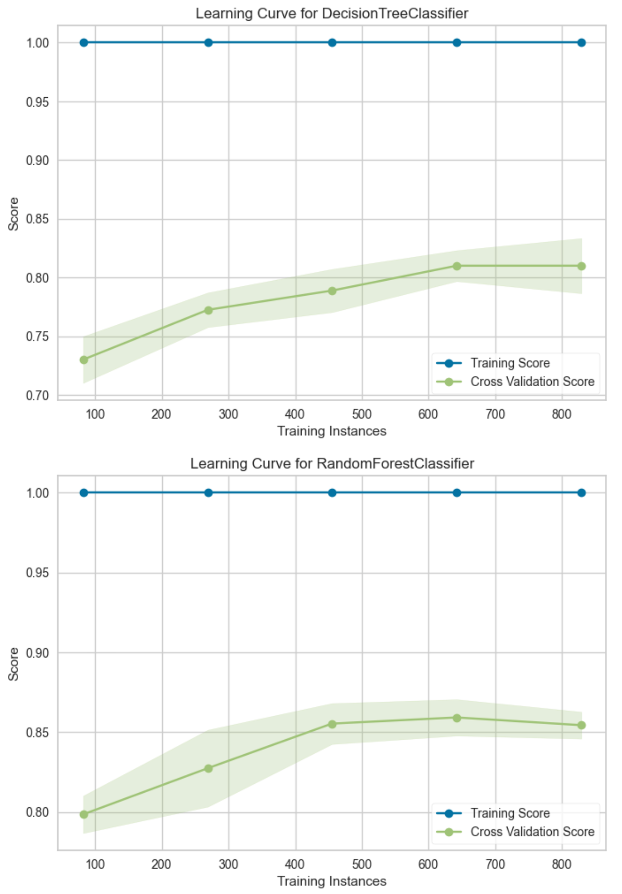
The dataset is imbalanced (74% non-churn, 26% churn), requiring SMOTE (Synthetic Minority Over-sampling Technique) to enhance model learning. The Decision Tree model, using the Gini Index, provides transparency but risks overfitting. The Random Forest model, an ensemble learning approach, reduces overfitting and improves predictive accuracy.
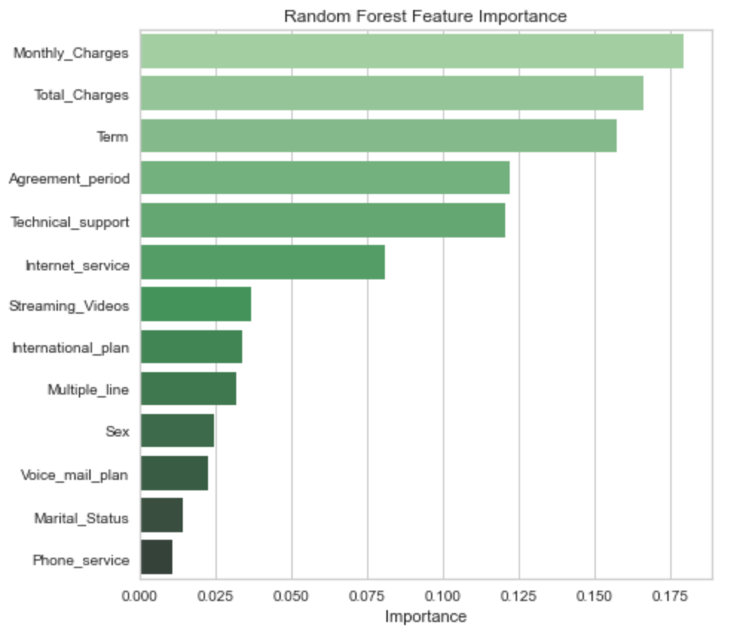
Performance evaluation metrics include accuracy, F1-score, and ROC AUC, with Random Forest outperforming Decision Tree (85% accuracy vs. 79%). The analysis reveals that Monthly Charges, Agreement Period, and Internet Service type are the top predictors of churn. These insights enable data-driven retention strategies, such as targeted discounts, long-term contract incentives, and service improvements. Future refinements include real-time prediction deployment and advanced models like XGBoost.

Data Preparation & Pre-Processing
Handling Class Imbalance: SMOTE (Synthetic Minority Over-sampling Technique)
Feature Encoding: Binary & multi-class categorical variable transformation
Train-Test Split: 70% training, 30% testing for model generalization
Predictive Modeling & Hyperparameter Tuning
Decision Tree: Gini Index, Max Depth tuning to balance complexity
Random Forest: Ensemble learning with GridSearchCV for optimal hyperparameters
Validation Curves: Evaluating overfitting & underfitting across hyperparameter values
Model Performance & Comparison
Performance Metrics: Accuracy, F1-score, ROC AUC
ROC & Precision-Recall Curve: Evaluating classification threshold trade-offs
Feature Importance Analysis: Identifying key predictors of churn
Business Insights & Strategic Recommendations
Retention Strategies: Discounts for high-churn-risk customers, long-term contract incentives
Service Improvements: Addressing Internet Service dissatisfaction & enhancing technical support
Future Enhancements: Real-time churn prediction, Gradient Boosting (XGBoost), customer sentiment analysis
Use the link below to download a presentation summarizing the findings of this model.

Coming soon…
In the future, I plan to post more of the certificate coursework I’m currently working on, as well as some of my personal side-quests I’m exploring in python.
Check back soon!